Oliver Schaer, a colleague of mine at Drexel University, US, invited me to talk about my current research with Nikos Kourentzes in forecast evaluation; we call it forecast congruence.
This research was inspired by my last published paper in shrinkage estimators for exponential smoothing (ETS) models. A shrinkage estimator in ETS results in a smoother line, compared to MLE, and the forecasts over origins are pretty much similar. Then, this intrigued me: well, if I were a decision maker, I would have liked this kind of forecasts! There must be some values. I reached out Nikos and we are now writing this research paper.
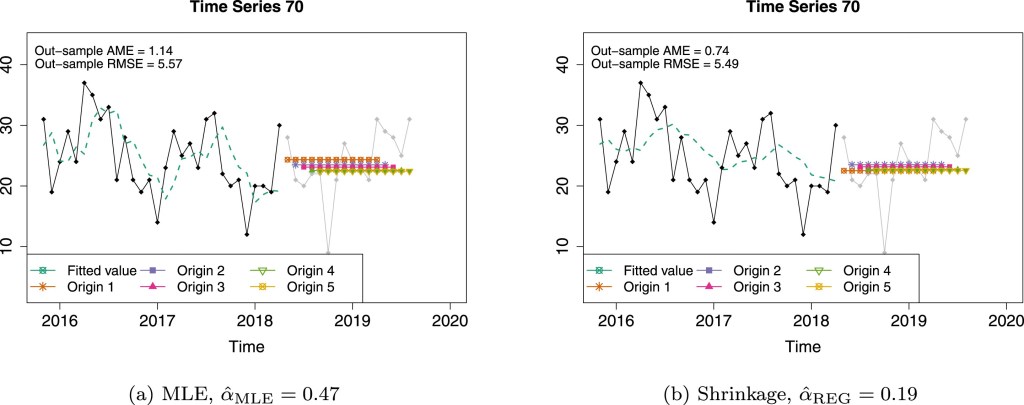
We call forecasts with this characteristic as forecast congruence. Now, how do we know that some forecasts have this characteristic? Then, we propose a way to measure it, and this is what we call the congruence metric. It is actually a variance of forecasts of a specific date, given that different sets of information, and it basically measures the misspecification errors in the model. We also define the cut-off where the forecasts are over-congruent or under-congruent, inspired by overfit and underfit forecasts. Once we measure how congruent the forecasts are, we then find its connection with inventory decision metrics: lost sales, customer service level, mean stock-on-hand, standard deviation of orders, and the frequency we put orders.
All in all, accuracy is an important metric for achieving customer service levels, however congruence has a strong relationship with how often we order and the variability of our orders. This would eventually affect the bull-whip effect as well.
If you want to more in details, please have a look at our paper on SSRN or these slides below.
May useful forecasts be in your favour!
